SKI Gold Stock Prediction
- Subscribe to our Gold Stock Newsletter
- Take a free Preview of the System
- Learn about the SKI Gold Stock Prediction System
- Login For Subscribers
12/16/06
Archived SKI Update- » How Did it Work Out?
- » More From This Trade
» The Buy Signal
Nov 26 06
» The Sell Signal
Dec 16 06
Update Summary: Current USERX price = 15.98 New material in the Tables is bold-faced.
Current Position: Mechanical SKI bought on Tuesday (11/28/06) at 16.17 for a potential bull market but is now stopped out due to the 92-96 index sell signal and officially sells at Monday's (12/18/06) closing price.
Yes, the potential SKI bull market buy signal was negated this week as prices failed to stay up over the back prices. Whether prices rise on Monday (11/28/06) or fall, the 92-96 index will sell out at some small loss or profit or break-even. That's the way it's almost always been, as I showed in the 11/25/06 Update when the 92-96 index was about to initiate its buy. Of-course it's frustrating. The buy signal marked an imminent breakout to the upside on all kinds of daily and weekly charts that occurred two days after the index bought. The 92-96 index was saying that we were entering a potential bull market. That potential is now, as of this sell signal, for this moment, gone. The index is now saying that we have a potential breakdown ahead. Note that I am writing "potential" breakdown. The indices can and do reverse. The potential breakdown may not occur and instead, prices can simply reverse to the upside for another true (on the Path) and non-XXed Out 92-96 buy signal in a little more than a week.
As an investor, my first goal is to avoid losing significant amounts of money. My second goal is to make significant amounts of money. This 92-96 index sell signal can, and has in the past, marked a low. But if I bought every 92-96 index sell signal, I would be rather penniless. And if I held long on every 92-96 index sell signal, I'd be close to penniless. If prices turn higher over the next 5-6 trading days, the index will generate another true potential bull market buy signal. BUT THE MARKET MUST HOLD UP OVER THE NEXT FEW DAYS FOR THAT NEW TRUE 92-96 INDEX BUY SIGNAL TO OCCUR. In fact, when you read the analysis below, yesterday (Friday, 12/15/06) or Monday really need to be the low for the bullish scenario to occur. After this coming week, the potential for a new true SKI bull market will have passed for an indeterminate but apparently lengthy period of time. Don't ask me how the market and the indices interact to make these things happen. As always, I just attribute it to nature. It is real, it's always been this way (at least for the last 32 years) and I believe that nature and the indices are not going to change. I simply have to accept it without truly understanding the reasons behind it. I often think of the force of gravity. We can believe in that construct, measure it and observe its apparent effects, but we don't truly understand "why" gravity exists. But that's enough philosophy. The 16-20 and 92-96 indices will tell the tale this coming week.
If the next index signal is a 92-96 index buy signal, we are back to a potential bull market and Jeff will believe this new one more than I believed this past one that just failed. If the next signal is the 16-20 index buy signal (on falling prices), this short-term signal is on the Path. It is also XXed Out (because it immediately follows a longer-term sell signal; meaning that it is not supposed to be bought). Furthermore, even if prices temporarily hold or rise after the 16-20 index buy signal, thereby generating a 92-96 index buy signal, SKI will say that is NOT a bull market (because the 92-96 index will NOT be on the Path). It would be extremely difficult for the system to work its way out of that situation and yield a true bull.
The 92-96 index back prices peak on this coming Monday (12/18/06) and then begin to decline on Wednesday and Thursday. The 16-20 index back prices begin to rise on Monday. THE TWO INDICES' BACK PRICES WILL CROSS ON THURSDAY. For the bull to occur, prices MUST stay above the 16-20 index back prices and avoid generating that XXed Out buy signal. If the rise occurs this week, the 92-96 index buy will be generated. Here are the indices' back prices for this coming week:

You can see that the 16-20 index will begin breaking on Monday 12/18/06 if prices don't rise to over 16.09 (current price is 15.98). For SKI experts, the affiliated 15-19 and Composite indices have already been hit/touched broken on Friday (12/15/06). It looks like Friday will need to have been the low for the bullish scenario to occur or at worst, a small decline on Monday. A significant drop on Monday (12/18/06) will make it very hard to avoid the 16-20, 15-19, and Composite XXed Out buy signals.
Psychological Review of this last 92-96 Index Buy/Sell: Now that the 92-96 index has sold and we know the history of the past three weeks that it's been on its buy signal, I thought that I'd review my own psychology and actions and how they affected the writings that I send to you.
My skepticism at the start of this trade caused me to buy in at only 50% on the 11/28/06 92-96 index buy signal at 16.17. Although that skepticism, based upon experience, was borne out as being correct, it still hurt the bottom line. When the market exploded higher a few days later, I refrained from buying more because such a 7 consecutive day run up can mark a high and prices should correct anyway. That explosion on 11/30/06 caused prices to breakout to the upside on weekly charts and turned almost all analysts that I read into long-term bulls. The next day (12/01/06) prices declined, breaking the run up, and I wrote how a close over the top of that 7-day run should be another break-out and that I would add to my long position. That weekend I watched Jim Cramer on "Mad Money" saying to buy gold stocks (KRY and AUY) and that he recommended 10% of one's money should go into gold stocks. I take that as a contrary indicator (no disrespect intended), but on that Monday, KRY rose about 20%, all the gold stocks were strongly higher and closed over the top of the 7-up run.
That new high was actually sickening because I had written to buy more and that I would add some leverage, yet I still didn't like the way that the market was unfolding and remained skeptical. So I didn't add everything and bought another 25% into USERX and bought just one-half of my normal leverage. It was those subsequent purchases after the "breakout" that caused me to lose money. I should have either just bought everything on the index buy signal or accepted the fact that half my money and the leverage were going to miss the boat until a bull market correction in a month or two that brought prices down to the indices (at some higher price). The drop in the stocks wasn't bad, but gold and silver really took a hit. I am thankful that I only did half leverage, but it was still most hurtful.
As the gold stocks drifted down, they hit the 92-96 index on the critical day of Tuesday (12/12/06; as specified in last weekend's Update). Alert subscribers received a message that day saying that prices had hit the index and that this had better be support. If it was support, I expected prices to rise nicely the next day, but prices were flat and USERX was declining slightly. I therefore sent the sell message to traders and I sold on 12/12/06 at USERX 16.23. It was still unclear whether the 92-96 index would sell and it would take at least 2 more days for the index to sell, but my experience convinced me that I'd better get out. As soon as I could see that the index was going to sell, I sent the Friday (12/15/06) brief Update. Perhaps I should have sent that Update on Wednesday, BUT IF PRICES REALLY RALLY HIGHER ON MONDAY 12/18/06, LONGER-TERM INVESTORS WHO TRADE LESS FREQUENTLY CAN STAY LONG AND USE THE XXed Out 16-20 INDEX "BUY" SIGNAL AS A SELL STOP (One would sell as soon as the XXed Out 16-20 index buy signal was being generated).
With Silver having plunged a dollar on Friday, prices having hit their weekly support lines on the charts, and the SKI indices marking this point, this really could be a low and we could get a new true bull market signal. But I still wonder, "Where's the life run plunge?" and "How can we get a true bull so quickly after the May death run?" Nonetheless, I'll have to buy a new true 92-96 index signal should it occur and I will buy the signal without adding after the signal until there is a correction.
Highly uncertain at this new critical point, Jeff
CURRENT STATUS
SKI (The Mechanical System) = Flat. The bullish 92-96 index buy signal will sell on Monday 12/18/06.
JEFF (The Person) = 75% long by buying 25% more on 12/05/06 at USERX 16.84 and initiated 50% leverage on Tuesday 12/05/06. Bought 10% on 11/27/06 at 16.11 and 40% more on 11/28/06 (92-96 index signal day) at 16.17. In retrospect, I should have just bought 100% on signal day, as per my colleague. Flat, in cash. Sold all positions on Wednesday 12/13/06 at USERX 16.23.
The SKI System generated a new potential true bull market on 11/28/06 at USERX 16.17. The definitive stop is always a 92-96 index sell signal that was generated on 12/15/06 for execution on 12/18/06. It can re-generate a new and better long-term bull market signal in about 6 trading days if prices rise a little. Mechanical SKI made 84% via its true bull market 92-96 index buy signal from 8/09/05 to 9/12/06, lost 9% on its theoretical short from 9/12/06 to 11/28/06, and is currently down 1% from its 11/28/06 buy.
Long-term (months to years): Flat/Uncertain.
Intermediate-term (weeks to months): Flat/Uncertain.
Short-term (3 trading days to 1.5 weeks): Flat.
Note: Jeff can't remember the last time he's written Flat/Uncertain for every time frame. Right or wrong, there's usually some index trend.
Based On Prices as of the Close of December 15, 2006
|
Rank |
Indicator |
Signal |
Comments |
|
1.Controlling: |
92-96 |
SELL “Buy” Sell Buy SELL |
Long-term Bearish since selling on 9/12/06 at USERX 14.85. Prices rose into an XXed Out “buy” signal executed on 10/25/06 at USERX 14.94. Should mark a high, but prices rose to the 35-39 XXed Out buy signal. This is allowed but rare. Sold on 11/17/06 at 15.23 for an unexpected but small 2% profit on the XXed Out trade above. Sell signal rarely marks a low, but it did mark a low to the day. Bull market buy signal was generated on 11/27/06 and executed on 11/28/06 at USERX 16.17. Sell generated on 12/15/06 for execution on 12/18/06. Ends the bull but could be marking a low and a new bull buy signal would occur in about a week. |
|
2.Secondary: |
35-39 |
SELL “Buy” |
Intermediate-term Bearish since selling on 9/15/06 at USERX 14.56 (although it was mechanically sold out with the above 92-96 controlling index on 9/12/06 at USERX 14.85). Prices rose into the XXed Out “buy” signal, executed on Monday 11/06/06 at USERX 15.61. SHOULD MARK A HIGH!!. It “did” mark a high but actually missed it by 3 days as opposed to the normal 1 day miss. This trade sold out on the 92-96 index sell (above) at 15.23 for the expected loss. |
|
3.Others: |
15-19 15-19 and Composite
15-19 and Composite |
“SELL” meaning BUY “Buy” meaning SELL
Hit/touched/broken on 12/15/06 towards a buy signal |
“Bought” so it Sold on 9/07/06 at 16.35. “Sold” so it Bought on 9/14/06 at USERX 14.49. This buy signal was XXed Out due to the controlling 92-96 index sell coming immediately before it. This buy signal was to be avoided, but does indicate short-term oversold conditions. “Bought” so it Sold on 10/18/06 at USERX 14.17. The XXing Out of the prior buy (see above) was correct since that buy came at USERX 14.49 and 14.92. Such touches can mark lows. Prices need to rise to avoid generating this XXed Out “buy” signal for the market to be bullish. |
|
|
16-20 and Composite 16-20 16-20 |
“SELL” meaning BUY “BUY” meaning SELL Will be hit/touched broken on Monday 12/18/06 if prices stay below 16.09 |
“Buy signal” (so it SOLD) on 9/07/06 at USERX 16.35. “Sold” so it Bought on 9/13/06 at USERX 14.92. This buy signal was XXed Out due to the controlling 92-96 index sell coming immediately before it. This buy signal was to be avoided, but does indicate short-term oversold conditions. “Buy” so it SOLD on 10/19/06 at USERX 14.65. That spike higher day probably was the high marked by the index (again), but although it was a high in gold, USERX continued higher (as was allowed) to the 92-96 index. Such touches can mark lows. Prices need to rise to avoid generating this XXed Out “buy” signal for the market to be bullish. |
|
|
218-222 |
BUY |
Extremely long-term very bullish. Its back prices are rising, currently up to 13.41 this coming week before falling back to 11.72-12.20 the following week. Prior corrections have taken prices down to this index, but that obviously can’t happen now if we are to get a new and true 92-96 index buy signal. |
|
|
439-443 |
|
Bullish and out of the picture. |
|
|
660-664 |
|
Bullish and out of the picture. |
|
4.Run Pattern: |
3 Down and 7 Up Run |
Important
|
Marked a low and has marked an important high 4 out of 7 times. The run ran up to 16.78, so that is either the high according to the run pattern or prices should be off to the races. Prices rose one day above the high of that run and have corrected. This run pattern was the ultimate “hook”, sucking in the longs as the run high was exceeded. |
|
Colleague |
|
|
Bought 100% USERX on the 92-96 index buy signal on 11/28/06 at 16.17. Selling on Monday 12/18/06 on the 92-96 index sell signal. |
(1) This indicator is the “controlling” indicator because it came first, it was On the Path and was not XXed Out, a true potential bull market that is selling out as the safety stop was hit.
(2) This indicator is the “secondary” indicator because when it buys it’s been profitable 92% of the time during bull markets but it is not On the Path. It usually sells at a low during bull markets, but such a bullish “sell” signal needs to be tied or come after a 16-20 index buy signal. Even a simple touch/hit/break of this index after a 16-20 index buy signal marks an intermediate bottom. This index is currently out of the picture because it gave an XXed Out buy on 7/13/06 at 15.59 and was sold out by the 92-96 index sell signal on 7/24/06 at 15.23. All this occurred before the 92-96 index bought. If we get a new bull market in a week, the 35-39 index can’t get into the picture for several months because its back prices are low. If we get the XXed Out 16-20 index “buy” signal, prices should fall to the next area, the 35-39 index that is rising to 15.30 by the end of the week.
(3) This indicator’s back prices will be rising this week. Since the 92-96 index (above) has generated its sell, the subsequent 16-20 index buy signal, as prices fall, will be XXed Out because it immediately follows a higher-order (92-96 index) sell signal. If this “buy” signal occurs, it would be bearish. Prices are allowed to hit/touch/break it at a low, but prices must then rise without generating the signal in order to be bullish.
(4) Important: The 3 Down and 7 up run of-course marks a low (known only after it has gone up multiple days), but has marked a high as well 4 out of 7 times. Therefore, a close above the end of the run up, at 16.78 is very bullish. We got the close over that high on Monday (12/04/06). The market corrected thereafter into the end of the week. It feels as though that close over the run high was a “hook/trick”, but the 92-96 index will provide the answer: As long as the 92-96 index remains on its buy, SKI remains mechanically bullish. It happened and the run was a “hook”.
______________________
Website News: Nothing new.
The FAQ link on the website (found in the free section before log in, in the “About SKI” link, then on the right) had been broken when I wrote last weekend on reading that area to see how to estimate USERX’s price. It was fixed a few days later. The link to Morningstar is useful, but Morningstar is often delayed in updating their files. A link to the top ten holdings is the U.S. Global Investor’s site:
http://www.usfunds.com/funds/goldshares_doc.asp?viewid=Composition
Recent government legal actions regarding newsletter writers has led to legal advice that I should maintain a separation between comments regarding stocks and futures. The SKI website will shortly remove much of the information regarding futures and will be replaced with links to the SKI futures site (http://www.tradegoldfutures.com/ ). I am also legally required to stop sending hypothetical performance data from 1998-2005 because actual trading results are available at that site or upon request. I am also advised to cease referring to futures in these Updates but I will use the term “LEVERAGE” without specifying the type of leverage employed (e.g., margin, futures, leveraged mutual funds).
Nov '06
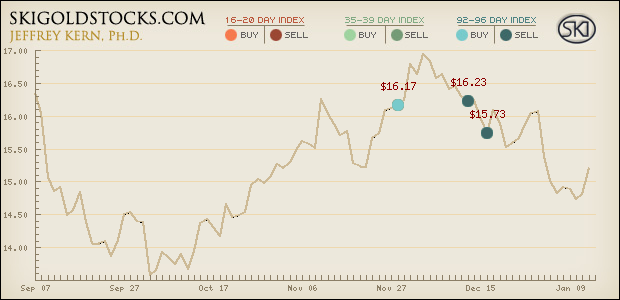
| SKI BUY SIGNAL | SKI SELL SIGNAL | Jeff Sold | SKI Gain/Loss | Jeff's Gain/Loss |
|---|---|---|---|---|
|
Buy Signal 11/28/06 $16.17 |
Sell Signal 12/16/06 $15.73 |
12/13/06 $16.23 |
$-0.44 | $0.06 |
Fake SKI Bull Market, nothing is perfect, but it's just a small loss » The Buy Signal Nov 26 06 » The Sell Signal Dec 16 06 |
||||
© 2026 All rights reserved. A publication of SKI Predictions