SKI Gold Stock Prediction
- Subscribe to our Gold Stock Newsletter
- Take a free Preview of the System
- Learn about the SKI Gold Stock Prediction System
- Login For Subscribers
11/25/06
Archived SKI UpdateMore About This Trade
- » How Did it Work Out?
- » More From This Trade
» The Buy Signal
Nov 26 06
» The Sell Signal
Dec 16 06
Title: 92-96 Index Generates A Buy Signal Current Position: Mechanical SKI Is preparing to buy on Tuesday (11/28/06). SKI still remains in cash or short with a new selling/shorting point having occurred on Wednesday 10/25/06 due to the execution of the XXed Out 92-96 index "buy" signal. Final top/selling point generated for 11/06/06 via an XXed Out 35-39 index "buy" signal off of the Path.
With this week's surge in the precious metals, the 92-96 index sell signal on 11/17/06 obviously marked the day of a low and the 92-96 index will generate its buy signal on the Path (and NOT XXed Out) on Monday (11/27/06) for execution on Tuesday (11/28/06) if the gold stocks do not decline 5.5% on Monday (such a rare decline isn't going to happen, so the signal is going to occur and I will confirm it via a brief Update on Monday early evening). It is the classic long-term (a year or more) buy signal. In August 2005 the index generated such a buy signal and Jeff had no real caveats and was quite excited. In all honesty, Jeff does have some concerns described below. Since the indices mark critical points, it is possible that this signal will be coming within a day of a high. Although that is not supposed to be the case, the history of such rare buy signals, from 1974-2006 is provided for your review.
History of 92-96 index buy signals: Long section deleted (SORRY, RESERVED FOR SUBSCRIBERS)
My conclusion form the above data is that this is the index buy signal that provides for the historically large gains during bull markets. Historically, if the 92-96 index isn't on a true buy signal, the precious metals are not in an exploding bull market period. That's why I say, "Don't worry, SKI somehow manages to catch the true bulls", as per last weekend's Update. I have that confidence based upon the above history. So the index/system doesn't miss the rises (stated in another way, there aren't false negatives). However, when this index buys, it does NOT guarantee a true bull market (stated in another way, there ARE false positives).
Jeff has deduced more detailed patterns that have prevented him from taking some of those losses. The primary pattern is when a 16-20 index buy or sell signal comes with the 92-96 index buy signal. Unfortunately, in the current situation, we do not have any such signals to assist.
Risk: The stop on such a 92-96 index buy signal is obviously a 92-96 index sell signal (when prices fall below the prices from 92-96 days ago). Those back prices are temporarily falling, dropping down to a low in the 14.66-14.93 area in 6 trading days. Therefore, after the buy signal, prices can decline without selling the index. Thereafter, the back prices rise
Therefore, 2 weeks after the buy signal, the risk is clearly limited. Of-course, we do not yet know what price SKI will be buying at on Tuesday. Jeff's fear is that prices will continue rising into Tuesday, yielding a high buy-in price in the 16.50 area. That would mean that SKI cannot sell at a profit for more than 5 months. But that is what is supposed to happen in a true bull market: Prices move higher for more than a year without selling SKI. One buys and holds and closes one's eyes.
Concerns:
- The obvious concern is: "Where is the life run plunge down"? This is my major concern. My colleague says that maybe this time it'll be different, but that is no help and is a dangerous statement.
- My colleague's major concern is that we've never had a new true bull market begin so quickly after the prior one has ended via a 92-96 index sell signal after such a large and year-long rise.
- If prices rise for another two days into the signal, the run pattern will be 3 Down and 5 Up and might average about 2% a day. That can be a classic run marking a low AND a high. I am hoping that this doesn't occur and that prices decline for at least one day on Monday and/or Tuesday, but my impression is that prices will rise into the signal.
Bottom Line: I really wanted to send the buy message on Friday, but my colleague reminded me that jumping the gun is dangerous. However, IF prices rise for the next two days into the signal, I will have to recommend waiting a few days, looking for some decline to buy. WE ARE SIMPLY SUPPOSED TO BUY VERY SOON AND HOLD ON A 92-96 INDEX BUY SIGNAL, WHATEVER THE OUTCOME MAY PROVE TO BE. As written last weekend:
"…the pattern of an XXed 92-96 index buy signal, followed by a 92-96 index sell signal, immediately followed by a new 92-96 index "true bull market" buy signal is CLASSIC bull market SKI. It is THE classic pattern. That is how the late 1970s bull started. That is how the 1993 bull started. And you might recall that it is how the 2005 SKI bull market started (with the prior 92-96 sell signal marking a low and prices rising into the true buy). The SKI indices are now ready for the bull. We'll see if happens. It should happen in about a week if it's going to occur."
I would now add, once again, that this pattern IS the way that bull markets begin, but there are false positives (the pattern has also occurred into several of the losing 92-96 index trades). Bull markets also don't go continually straight up. Hence, if this is the start of the next bull phase, there will be additional entry points on declines to the 16-20 index and the 35-39 index (as per last year's bull). In fact, we could get a rise and then a decline involving a life run in several months (to make "everything" correct) back down to this very price area, thereby generating the 35-39 index's sell signal (marking an intermediate low) and buy signals (signaling an impulsive leg up that is perfect for leveraging). That is how the greatest rise, the March 1979 92-96 index buy signal, began….
Best wishes, Jeff
_______________________________
CURRENT STATUS SKI (The Mechanical System) = Preparing to buy in 2 trading days. 100% cash or short from 9/12/06 at USERX 14.85 and said to sell again and/or short for 10/25/06 at USERX 14.94. Again said to sell or short on the XXed Out 35-39 index "buy" signal executed on Monday 11/06/06 at 15.61. Completed its gain at 84% on 9/12/06 at 14.85 from the 8/09/05 bull market buy at USERX 8.07.
JEFF (The Person) = 100% Cash since closing his short position at the exact high for "safety". Not surprising. You know that I've done it before. I knew it as I was doing it and truly didn't do it due to fear. I said to myself, "I can't take more risk". I was also hit with frantic SKIers contacting me that I should cover their short positions because they didn't want to lose more. Should have just stayed with SKI. Now it's hard to re-short because the time to do it was on that XXed Out 35-39 index buy signal (which I did!). Note that I wrote last weekend: "There's now a chance that this 92-96 index sell signal is marking a low (although I doubt it), so shorting now is at greater risk than the prior recommendation to short." Jeff is ready to buy, if not on the day of the signal, then shortly thereafter on a decent down day. Jeff would like to be able to buy at a price at or below where he sold all of his position in early September (16.35-16.04).
The SKI System has completed its true and rare long-term bull market 92-96 index buy on 9/12/06 at USERX 14.85 after buying on 8/9/05 at USERX (the gold stock mutual fund) 8.07. It is in cash or short, but is about to generate its POSSIBLE bull market buy signal. Since SKI officially went short on 9/12/06 at USERX 14.85 and the current price is 15.23, SKI sits at a 7-8% loss on this hypothetical short position (one can't short USERX). The definitive stop for the next few weeks on this short position is a new 92-96 index buy signal.
Long-term (months to years): On a very long-term basis, SKI remains BULLISH due to the 218-222 index, and is about to generate a long-term buy signal.
Intermediate-term (weeks to months): About to go long due to a 92-96 index buy signal.
Short-term (3 trading days to 1.5 weeks): A 92-96 index buy signal is a long-term signal and does not indicate anything regarding short-term price movements. However, if prices rise for another 2 trading days into the signal, some consolidation/decline would be anticipated. ____________________________________________ "Buy"

He reports that he netted 51% short-term capital gains from the start of the SKI bull to the end of the bull, as compared to the system's 84% long-term capital gain. He vows not to get "sucked" into a buy until a "life run", a 16-20 index buy signal on a plunge, or a true bull market 92-96 index buy signal. He is getting his 92-96 index buy signal but has said that he'll wait to see "what happens" the next 2 days before deciding if he'll buy on the signal. He, as am I, is hoping that we get a down close before the run goes to 5 days up.
Detailed comments:
(1)This indicator is the "controlling" indicator and indicates a SKI BEAR market about to turn into a new bull. The SELL prediction is for sure, meaning greater than 98% chance based on analysis of previous statistics dating back to 1974. For this signal to be canceled or reversed, prices would need to form a "life run" on a plunge OR a new 92-96 index buy signal on the Path that is not XXed Out.
(2) This indicator is the "secondary" indicator, an intermediate-term index. It usually buys at highs during bear markets but such a bearish "buy" signal needs to be tied or come after a 16-20 index sell signal (i.e., on a rise). Even a simple touch/hit/break of this index after a 16-20 index sell signal can mark an intermediate top, but during bearish periods, the 35-39 index usually generates its signal. THIS SIGNAL WAS EXECUTED ON 11/06/06! This index now has sold its trade via #1 above; all is well. If the index itself sells, it will probably be as the large triangle from May 2006 to is broken to the downside. If we get a new bull market 92-96 index buy signal, it won't be selling for many months.
(3) This indicator sold on 9/07/06 and bought on the plunge (as it is supposed to do), but it is XXed Out. It still CAN mark a short-term low, but the odds are about 70% that it will eventually sell on a rise that does not take it above its buy-in price at 14.49/14.92. It CAN mark a short-term low, but it is a dangerous buy, so it is avoided. The XXing Out was correct. Currently on a sell signal indicating overbought conditions.
(4) Bullish but not a powerful indicator.
______________________ Website News: Nothing new.
The FAQ link on the website (found in the free section before log in, in the "About SKI" link, then on the right) had been broken when I wrote last weekend on reading that area to see how to estimate USERX's price. It was fixed a few days later. The link to Morningstar is useful, but Morningstar is often delayed in updating their files. A link to the top ten holdings is the U.S. Global Investor's site:
http://www.usfunds.com/funds/goldshares_doc.asp?viewid=Composition
Recent government legal actions regarding newsletter writers has led to legal advice that I should maintain a separation between comments regarding stocks and futures. The SKI website will shortly remove much of the information regarding futures and will be replaced with links to the SKI futures site (http://www.tradegoldfutures.com/ ). I am also legally required to stop sending hypothetical performance data from 1998-2005 because actual trading results are available at that site or upon request. I am also advised to cease referring to futures in these Updates but I will use the term "LEVERAGE" without specifying the type of leverage employed (e.g., margin, futures, leveraged mutual funds).
Nov '06
| SKI BUY SIGNAL | SKI SELL SIGNAL | Jeff Sold | SKI Gain/Loss | Jeff's Gain/Loss |
|---|---|---|---|---|
|
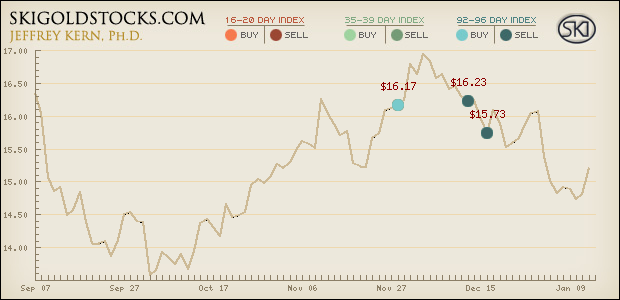
Buy Signal 11/28/06 $16.17 |
Sell Signal 12/16/06 $15.73 |
12/13/06 $16.23 |
$-0.44 | $0.06 |
Fake SKI Bull Market, nothing is perfect, but it's just a small loss » The Buy Signal Nov 26 06 » The Sell Signal Dec 16 06 |
||||
© 2025 All rights reserved. A publication of SKI Predictions