SKI Gold Stock Prediction
- Subscribe to our Gold Stock Newsletter
- Take a free Preview of the System
- Learn about the SKI Gold Stock Prediction System
- Login For Subscribers
January 7th, 2004
Archived SKI Update- » How Did it Work Out?
- » More From This Trade
» Buy Signal
Jul 23 003
» Renewed Buy
Jul 30 03
» Alert: Major High
Dec 04 03
» Alert: Jeff Sells
Dec 09 03
» Sell Signal
Jan 07 04
You can read the writers who are bullish on gold stocks and the writers who are bearish on gold stocks. Some of these technicians will be correct and some will be incorrect right here. One definition of wisdom is the possession of enough knowledge to know what/when you can’t predict with accuracy (“knowing what you don’t know”). The paradox is that when I know enough not to make a prediction (and avoid risking my money) I will appear to be wrong to one “camp” of readers or another. After all, I can’t be right! This market will move dramatically over the next few weeks. The gold stocks’ technical formations (relative to the SKI indices) are extraordinarily fascinating right here, but I don’t know which way it will go. I therefore sold on today’s ugly gold stock decline at USERX 8.84 for a .3% profit. My shortcoming on this trade, which eradicated most of my profit, was waiting a day too late to buy and a day too late to sell. Nonetheless, the extra days waited dramatically decreased the likelihood that I could lose on this trade.
You’ve just got to look at the index back prices that are coming up over the next 2 weeks and have a real chance of understanding how the market can/will move relative to these prices. Right now provides an excellent learning opportunity. The way in which it moves will provide the next high probability prediction (investment opportunity). This is a time to watch people’s behavior using the SKI indices as a map/guide. Here are the prices from 16-20 days ago and 35-39 days ago as of this past Monday and through the next two critical weeks. For example, on Monday 1/5/04 the five 16-20 index back prices were 8.98-8.28 and on Tuesday 1/6/04 the back prices were 9.20-8.45.
| As of | 16-20 index back prices 35-39 | index back prices |
|---|---|---|
| 1/5/04 | 8.98 | 7.38 |
| 1/6 | 9.20 | 7.54 |
| 1/7 | 9.15 | 7.59 |
| 1/8 | 8.86 | 7.53 |
| 1/9 | 8.28 | 8.04 |
| 1/12 | 8.45 | 8.06 |
| 1/13 | 8.59 | 8.26 |
| 1/14 | 8.59 | 8.17 |
| 1/15 | 8.36 | 8.62!!! |
| 1/16 | 8.44 | 8.67!!! |
| 1/19 | 8.35 | 8.61!!! |
| 1/20 | 8.13 | 8.57!!! |
| 1/21 | 8.09 | 8.30 |
| 1/22 | 8.07 | 8.44 |
| 1/23 | 8.28 | 8.91 |
| 1/24 | 8.49 | 9.09 |
| 1/27 | 8.81 | 9.29 |
This Monday, the USERX closing price of 9.30 gapped up and vaulted over the 5 back prices yielding a +5 on the 16-20 index. That started/hit resistance. As soon as the index is hit, be on alert, the signal itself may be 1-3 days off hitting the high or low. On Tuesday 1/6, gold itself spiked up and then the gold stocks sold off. Danger. USERX fell to 9.16 (look at the back prices) to yield a +3 on the 16-20 index. It needed to stay above 9.15 to generate the sell signal. Today, Wednesday 1/7, prices plummeted to 8.84 (I expected 8.87 to stay over the 8.86), to yield a +1 and generate the actual sell signal.
Note how tomorrow (1/8) prices can continue to fall to the breakout area of 8.62 without affecting the 16-20 index (whose prices are falling). I expect that drop into support, which still will not hit those rising 35-39 back prices (that come up to 8.62 the next day!). And it will still sell the 16-20 index trade out at a profit (that was the prediction). A fall tomorrow to about 8.63 would therefore hit expected support. An ensuing rise needs to stay above the rising 35-39 back prices. A subsequent fall below the 8.57-8.67 area would generate the dreaded 35-39 sell signal and I’ll predict lower prices ahead. If prices stay above those 35-39 index prices and stay above tomorrow’s closing price for 9-10 trading days (should be easy to do if prices fall tomorrow?), that will be a breakout, requiring new highs (over USERX 9.37).
The current 16-20 index “sell” signal is historically consistent with a major high. However, the last two times that this signal has occurred, gold stocks continued to rise. That is still possible. Before that, since 1974, such signals always marked the end of major advances. I don’t know which way it’ll go. The last 3 days behavior is consistent with a major top and subsequent plunge for weeks/months. But if the bulls are correct, support at 8.59-8.67 will hold and I’ll be buying back over 9.50 within two weeks. The market took away my profit, but this behavior is beautiful from a scientific and technical point of view. Best wishes.
July '03 to January '04
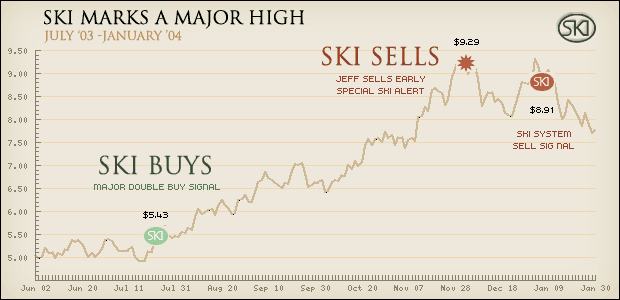
| SKI BUY SIGNAL | SKI SELL SIGNAL | Jeff Sold | SKI Gain/Loss | Jeff's Gain/Loss |
|---|---|---|---|---|
|
Major Double Buy Jul 23 03 $5.43 Jeff Buys More Jul 30 03 $5.42 Add long, renewed buy Oct 06 03 $6.43 |
Sell Signal - MARKS HIGH Jan 08 04 $8.91 |
Dec 12 03 $9.29 |
$3.48 | $3.86 |
On this particular trade, the SKI system accurately predicted a Major High in the Gold Complex. Again, Jeff's Special Alerts were invaluable as he saw the signal coming almost a month in advance and was able to exit with even greater profits. » Buy Signal Jul 23 003 » Renewed Buy Jul 30 03 » Alert: Major High Dec 04 03 » Alert: Jeff Sells Dec 09 03 » Sell Signal Jan 07 04 |
||||
© 2026 All rights reserved. A publication of SKI Predictions