SKI Gold Stock Prediction
- Subscribe to our Gold Stock Newsletter
- Take a free Preview of the System
- Learn about the SKI Gold Stock Prediction System
- Login For Subscribers
May 26th, 2002
Archived SKI Update- » How Did it Work Out?
- » More From This Trade
» The Sell Signal
May 26 02
Since the last Update on 5/21/02, USERX has risen each of the last three days, rising 6 cents to 5.97 on Wednesday, 45 cents! to 6.42 on Thursday, and 1 cent to 6.43 on Friday. I sold on Wednesday as I was traveling to a remote location and I only obtained the results today. USERX simply exploded without warning on Thursday as it continues to lead the world’s mutual funds. When I sold on Wednesday while on the road, I truly thought that I should hold long into the 3-day full-moon weekend that in now upon us. But I had no way of selling on Thursday or Friday. That was a very expensive vacation (smile) due to lost profits, but the 4 inches of snow on Wednesday and the gorgeous weather and sights were almost as good as the lost profits.
I grossed 15% in 5 days as USERX experienced the greatest run up in history. The run is now at 2 down and 7 up, rising an average of almost 3.5% per day. Such runs have ALWAYS marked major highs EXCEPT during the greatest bull markets in history (e.g.., during the late 1970s). THIS RUN PATTERN, ACCOMPANIED BY A 3-DAY WEEKEND, A FULL MOON, AND A 1106 INDEX SIGNAL EXECUTED ON FRIDAY’S CLOSE, HAS ALWAYS MARKED MAJOR HIGHS. Therefore, after USERX experiences its first down day, that should be a major high.
Gold ended its run of 7 straight days up with a down close on Friday. The run pattern and analysis on gold itself is completely consistent with the above conclusions on the gold stocks. Such a gold run is consistent with an intermediate or long-term high, but any close over that high will be indicative of a continuing rise and will also be consistent with a great bull market.
The above run patterns are powerful indicators. I usually recommend selling on the first down day in USERX and then re-entering should we ever experience a higher closing price than the price on the end of the run up. I have issued several incorrect warnings of a possible high ever since the 12/14/01 92-96 index bull market buy signal. These included 21 and 70 days from the last 35-39 index buy signal, as well as several 1 down and 2 up run patterns. Each historical topping pattern has been surpassed with ease. The current pattern is an even more powerful indicator of a high, and if it too is surpassed, that with be even more bullish. Either way, extraordinary patterns of human financial behavior are in the offing.
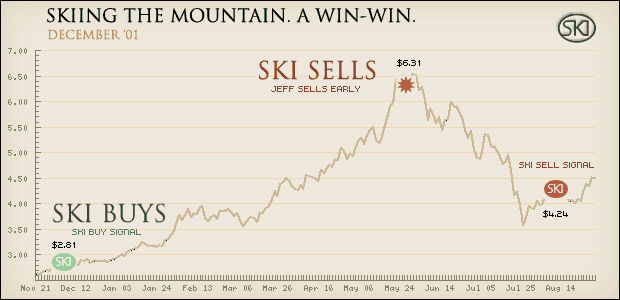
December '01

| SKI BUY SIGNAL | SKI SELL SIGNAL | Jeff Sold | SKI Gain/Loss | Jeff's Gain/Loss |
|---|---|---|---|---|
|
Buy Signal Dec 06 01 $2.81 |
Sell Signal Aug 12 02 $4.24 |
May 30 02
$6.31 |
$1.43 | $3.50 |
|
While the mechanical SKI signal was a winner, Jeff was able to call the top with perfection in this trade! » The Sell Signal May 26 02 |
||||
© 2025 All rights reserved. A publication of SKI Predictions