SKI Gold Stock Prediction
- Subscribe to our Gold Stock Newsletter
- Take a free Preview of the System
- Learn about the SKI Gold Stock Prediction System
- Login For Subscribers
February 25th, 2003
Archived SKI Update- » How Did it Work Out?
- » More From This Trade
» The Buy Signal
Dec 04 02
» The Triple Buy Signal
Feb 25 03
Introduction: The SKI prediction system for gold stocks is based upon a unique mathematical formula developed in 1985. Its development was theoretically driven but empirically derived, and has been cross-validated for the past 17 years. It contains three primary indices (or waves): a short-term 16-20 day index, an intermediate-term 35-39 day index, and a long-term 92-96 day index. Briefly stated, each index is generated by comparing the current day's price to the set of five back prices comprising that index. Note that such back prices will change each day and often change dramatically during very short time periods. The 35-39 and 92-96 indices generate buy signals as current prices rise over the back prices. However, the 16-20 index is a contrary indicator: As prices rise over the prices from a month ago the index generates a sell signal. The dependent measure used herein is a gold stock mutual fund with broad international holdings, US Gold Shares (USERX), similar to the Gold Heart measure recently introduced on Gold Eagle. You can read this page for a more detailed description of the SKI system: www.321gold/ . The unique nature of this technical analysis system should provide readers with insights that are relatively independent from traditional technical indicators. I do not derive any financial gain from providing this information beyond the fact that I follow the system for almost all of my financial decisions. In fact, most of my lifetime profits have resulted from short positions in the precious metals complex. All USERX prices cited below are adjusted for the reverse ten-for-one split occurring on 7/1/98.
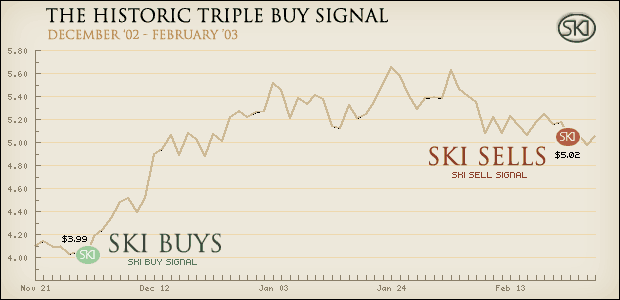
The purpose of this invited article is to provide an alert that the SKI system generated an index pattern of major historical significance during the first week of December 2002: A "Triple Buy Signal”. This "Triple Buy Signal" occurs when current prices close below the prices from the prior 16 through 20 trading days while concurrently closing higher that the prices from the prior 35 to 39 and 92 to 96 trading days. The 16-20 index buy signal occurred for the close of business on 12/02/02 at the USERX low of 3.99, the 35-39 index buy signal followed on 12/6/02 and the 92-96 index buy signal occurred on the following day, 12/9/02. This is depicted in the chart below.
Chart courtesy of Stock Charts
A Triple Buy had not occurred since the beginning of the SKI data set in 1974. However, its inverse, the Triple Sell, has occurred three times in the last 28 years. The Triple Sell pattern occurs when prices rise above the prior 16-20 prices while concurrently failing to rise over the prior 35-39 and 92-96 back prices. This situation typically occurs when a large current month's price rise (climbing over the 16-20 index back prices) isn't large enough to stay above rapidly rising prices from 35-39 and 92-96 days earlier.
History/Data: The first Triple Sell occurred early in July 1983 with USERX at $89.30. Note that although gold had topped in the $800 range in 1980, gold stocks came close to equaling their 1980 highs (USERX $105.30) in 1983. In retrospect, that first Triple Sell marked the beginning of the generational decline in gold stocks. That triple sell signal also ended a SKI primary bull market signal generated near the 1982 lows. Primary bull market signals are 92-96 index buy signals. Although there were several excellent rallies in the ensuing years, the system never generated a Triple Buy. In fact, even a primary bull market buy signal was not obtained until 3/15/93 at USERX $15.80. Prices had declined 82% from the first Triple Sell to the next primary bull market signal over a period of ten years. The bull market commencing in 1993 was followed by the second Triple Sell in the Fall of 1994. Note that the price of gold did not reach its exact top until a little more than a year later. However, the system never gave another bull market buy signal after that Triple Sell. USERX declined approximately another 85% from the second Triple Sell to a long-term bottom (buy) pattern on the exact day of the low (8/31/98) at USERX $2.94.
The 1998 bottom (buy) pattern was the equivalent of the two other great historical gold stock bottoms since 1974: The exact August 1976 USERX low of $11.30 and the exact USERX low of $29.40 in July 1982. That buy pattern had not only marked the two prior historical bottoms but also had never occurred at any other time (i.e., there were no false positives). It therefore appeared that the generational decline in gold stocks had ended. And, in retrospect, some gold stock measures (such as the Fidelity Select Gold mutual fund, FSAGX) have never gone lower than that day in 1998. However, after a 50% rise over several months, the SKI indices generated the third Triple Sell in November 1998 at USERX $4.02. This required the liquidation of precious metal assets, but appeared to make little sense: A unique historical bottom pattern had ended quickly with a Triple Sell that portended another multi-year decline. In fact, most gold stocks did end up declining over the ensuing two years, with USERX dropping to a low of 2.31 in November of 2000. And now the Triple Buy has occurred, essentially at the same price as that third Triple Sell, four years after the third Triple Sell.
Conclusions: Triple Sells were theoretically expected to portend severe declines lasting multiple years. That was born out by the price action that occurred after the development of the system in 1985. The first Triple Sell marked a secular decline in gold and gold stocks. This first Triple Buy should therefore mark the beginning of a secular rise in these assets. The short, intermediate, and long-term cycles have turned upwards. The SKI system appears to have marked out an enormous 4-year bottoming process that began with the buy pattern on 8/31/98. That was the left shoulder of a reverse head and shoulders bottom. The top of that left shoulder was marked by the third Triple Sell. The head, two years later in November 2000, was not marked by the system. The current Triple Buy would mark the right shoulder and the start of the upward breakout of that bottoming process commencing on 12/2/02. Although this article is being written subsequent to the sharp 2-month price rise that followed the Triple Buy, the interpretations given herein were posted elsewhere at the time of the Triple Buy and are not being stated on a post-hoc basis. Gold stocks are likely to be in a major up-trend for many years. The greatest gains usually occur in the latter "blow-off" stages of once-in-a-generation (or once-in-a-lifetime) rises. It will be interesting to see if the system obtains several (perhaps three?) such Triple Buy signals over the next 10-20 years.
Many of the traditional technical indicators that worked well during the secular decline will fail during the coming years. Short-term and intermediate-term overbought indicator will remain overbought as the price surprises will be to the upside, pulled upwards by the long-term trend in human behavior. Note however, that although the SKI system portends a secular rise, a shorter-term primary bull market signal has not yet been generated. It will take at least 6 more months and probably, several years before a 92-96 index buy signal is obtained. Until that signal is generated, gold stocks should experience longer and more severe periods of decline than during such primary bull periods as 1979-1980 or 1982-1983 (when the declines last only two or three months). Those declining periods should, however, come from much higher levels. The price levels of early December 2002 should not be seen again until years after the secular rise has ended. The end of this secular rise should be marked by a new Triple Sell lying years ahead of us.
Jeffrey M. Kern, Ph.D.
Email: skigoldstocks@yahoo.com
February 7, 2003
Jeffrey M. Kern, Ph.D., is an academic psychologist with a specialty in the measurement and prediction of human behavior. The communications provided are for informational purposes only and are not intended to be investment advice or recommendations for specific investment decisions. Dr. Kern is not a registered investment advisor. The information provided is considered accurate, but cannot be guaranteed. Investments/trading in narrow market segments or gold futures is for individuals willing to accept a higher level of risk for the opportunity of greater returns. Past performance is no guarantee of future performance. Communications should be sent to: skigoldstocks@yahoo.com
December '02
| SKI BUY SIGNAL | SKI SELL SIGNAL | Jeff Sold | SKI Gain/Loss | Jeff's Gain/Loss |
|---|---|---|---|---|
|
Buy Signal Dec 02 02 $3.99 Jeff buys more Dec 05 02 $4.34 Buy Signal Dec 12 02 $4.48 |
Sell Signal Feb 25 03 $5.02 |
Feb 25 03
$5.02 |
$1.03 | $1.03 |
|
This trade was punctuated by a historic Triple Buy Signal! » The Buy Signal Dec 04 02 » The Triple Buy Signal Feb 25 03 |
||||
© 2025 All rights reserved. A publication of SKI Predictions